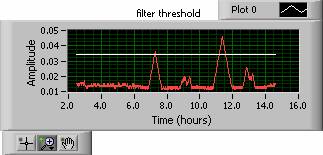
Data summary plots from 12 hours on 7/29/01 (2.31 am
to 2.35 pm). In the first two graphs, data from the simple
and filter triggers are plotted simultaneously.
The simple trigger was disabled so its data appear as a (white)
constant. There’s a lag time between the
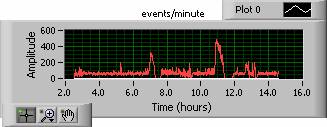
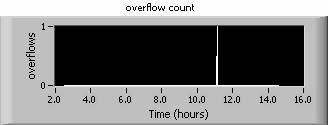
peaks in the event rate and the peaks in the threshold. Overflow count is the number of times the ADC
buffer overflowed because data processing fell behind data acquisition. This occurred once, when the event rate was
very high (500 evts/min
compared to 60 evts/min target). At this time the threshold was climbing as
fast as it could to lower the event rate (threshold step was
0.001/minute). So I think the adaptive
threshold is useful in this way: we effectively take more data (lower threshold)
when it is quiet, and less data (higher threshold) when it is noisy. The fraction of events captured during quiet
periods is higher with the adaptive threshold than it would be with a constant
one.
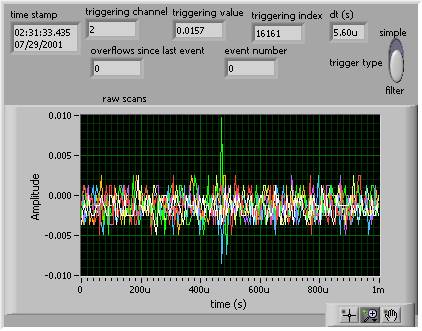
A signal of the shape we expect from UHECR?