Light Bulb Implosion Calibration
Lights were dropped from
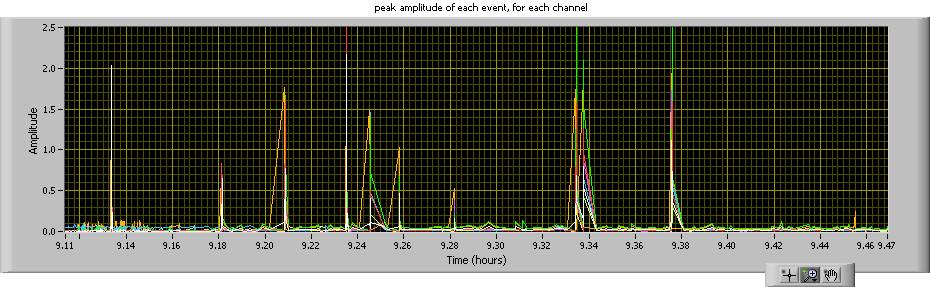
Fig. 1. The maximum signal amplitude of each recorded event, for each channel. Note that three events attained a voltage of 2.5, the upper limit of the ADC as it was configured. What looks like one thick event second from the right is two events.
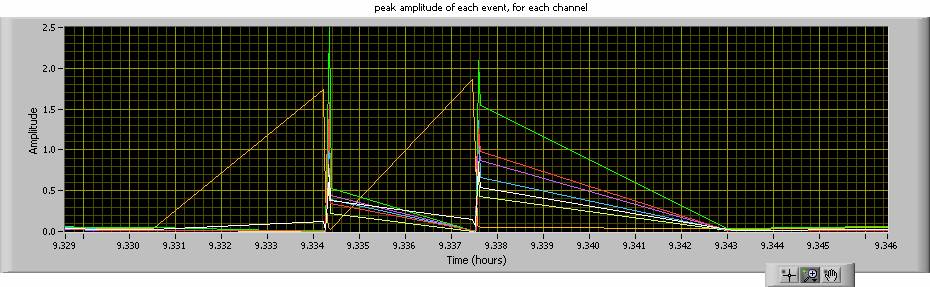
Fig. 2. Close-up of the two events. In each, note the lag time between the brown (center) phone and the other 6. We dropped from above the center phone, so the sound pulse reached it first, then the other 6 at nearly the same time. Each peak is plotted at the time it occurred to within the uncertainty of the DAQ card (ie the time of the peak within its event, not just the time stamp of the event, which is at the start of the captured sequence). Zooming in on either event shows the differences in time of arrival at each of the outer 6 hydrophones.
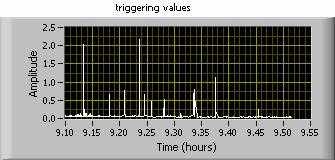
Fig. 3. Triggering values (first value above threshold for each event). This is less useful but quicker and the same ten events can be distinguished. This indicates that each peak was reached very quickly.
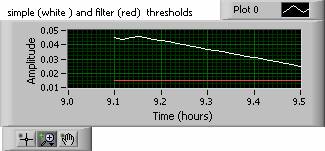
Fig. 4. Threshold over the same time period.
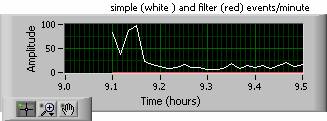
Fig. 5. Event rate. The drop in event rate and threshold is likely where we cut the engine of our boat. Perhaps we would have heard more bulb events (the little ones?) if we had given the threshold more time to adapt.
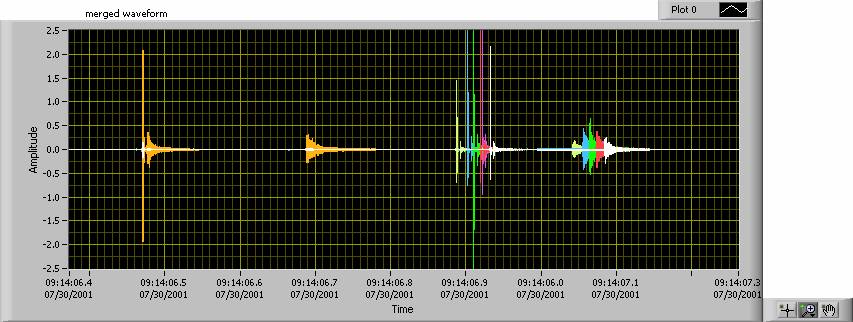
Fig. 6. Implosion events appeared individually as short segments of the whole signal. All events from one minute were sorted and merged to create this image. The straight-line segments connecting the signals are zero-padding from this merging (if it were captured there would be some non-zero signal there). Note first that the central hydrophone, hydrophone 341 (orange), was hit first and then the 6 outer hydrophones were hit with a very similar signal a half second later. The time and amplitude (except for several that saturated) of each signal are well enough known that we should be able to do precise triangulation. Within a single hydrophone, the signal is repeated with similar shape but attenuated and stretched. This is indicative of sea surface reflection.
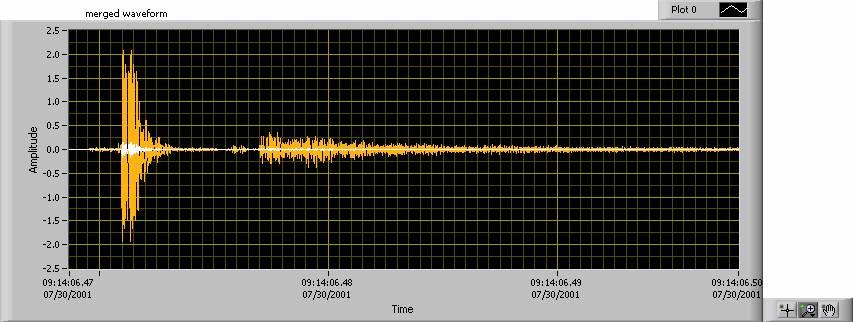
Fig. 7. Close-up of the central hydrophone signal (original signal, not including possible reflection).
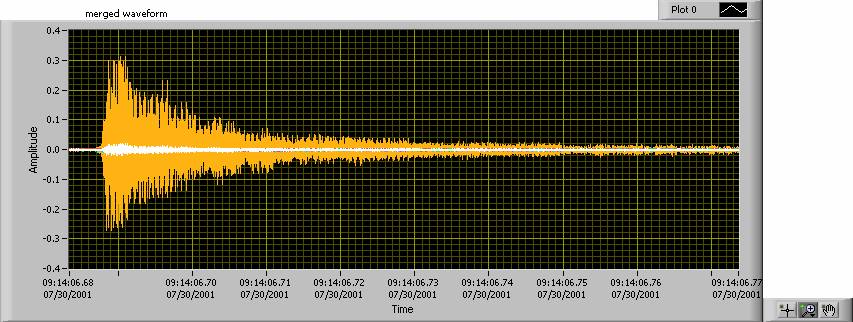
Fig. 8. Close-up of the possible reflection. The offset is 215 ms, or 1000 ft at a sound speed of 5 ft/ms. So if this is a surface reflection, the bulb imploded at a depth of 500 ft, which is reasonable.
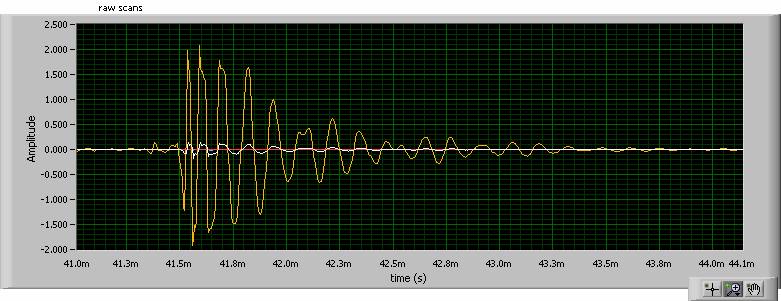
Fig. 9. A close-up of Fig. 7.