Log 13
Justin
Vandenbroucke
justinv@hep.stanford.edu
Stanford
University
3/11/03
This file contains log entries
summarizing the results of various small subprojects of the AUTEC study. Each entry begins with a date, a title,
and the names of any relevant programs (Labview .vi files or Matlab .m files
– if an extension is not given, they are assumed to be .m files).
Note: Higher-resolution
versions of the figures are available.
If a log has URL dirname/logLL.html, Figure FF of the log should be at
URL dirname/FF.jpg.
3/11/03
Distribution
of event energies
plotEstimateEnergies.m
Once a coincidence of 4 single-phone events have been
found, a 4-phone event position can be estimated. With this position estimate,
the event energy can be estimated. Figure 1 gives the spectrum of these event
estimates. Preliminary positons were used. Only events taken during quiet
minutes (threshold < 0.025) and with few cycles (ntyp < 4) were included.
Note that the mean energy is ~10^21 eV.
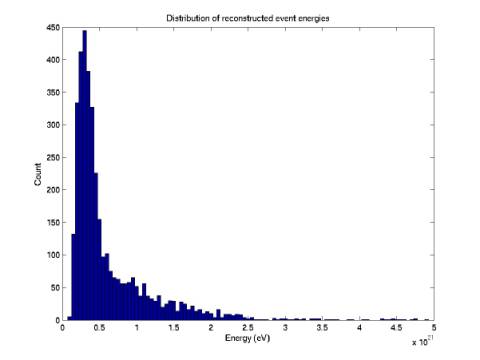
Figure 1
3/14/03
Restriction of effective volume
plotAcceptanceVsE0.m
Most of our acceptance calculations have assumed infinite
effective volume in all directions. But it is useful to restrict our effective
volume to a cylinder with radius ~10 km. Beyond this distance, ray bending
becomes significant, and position reconstruction becomes difficult. It also
becomes difficult to assure that the water is not blocked by the sea floor
beyond this distance. Figure 2 compares the acceptance with infinite volume
with that cut off by the 10 km cylinder (the lower set of 4 curves represents
that cut off by the cylinder). All curves are for a threshold of 0.02, the
maximum quiet threshold.
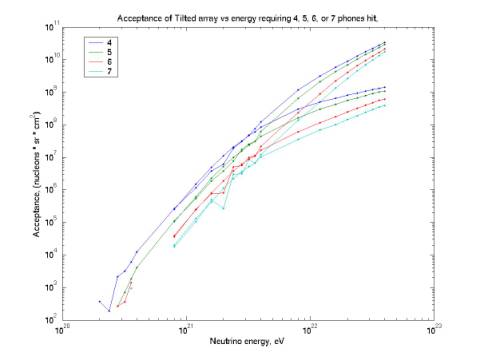
Figure 2
3/16/03
Effective
volume considering radiation pattern
plotEffVol.m
We
can reject events by considering the extreme shape of the radiation pattern
expected from neutrino events. Directly above the detector, there is no
orientation for which the radiation pattern will intersect at least 4 phones.
Farther away from the detector horizontally, events above the detector can be
tilted to an orientation that will intersect at least 4. The farther the
horizontal distance, the higher the maximum height above the detector at which
events can be detected. We can plot r (radial distance from central phone) vs. z (height above detector
plane) of the events (with any orientation) that can trigger 4 phones. Figures
3-6 give such plots.
These
plots map the effective volume of the detector (cut off by a cylinder at 10
km). In Figure 3, the radius of the radiation disk is only ~5 km, which means
there is a maximum r for the effective volume. In Figure 4, the maximum radius
reaches the bounding cylinder at 10 km. In Figure 5, the maximum height at this
radius continues to increase. In Figure 6, the maximum height has ceased to
grow.
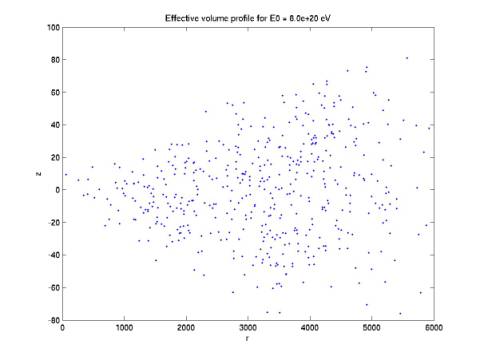
Figure 3
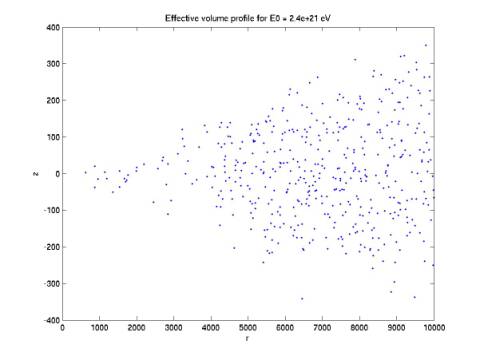
Figure 4
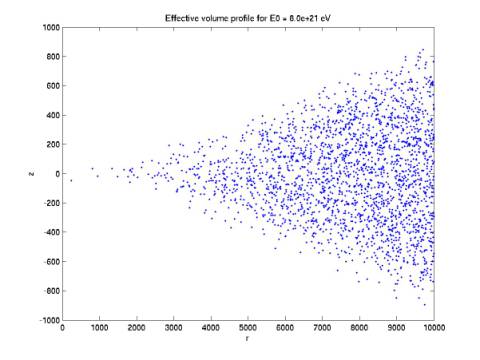
Figure 5
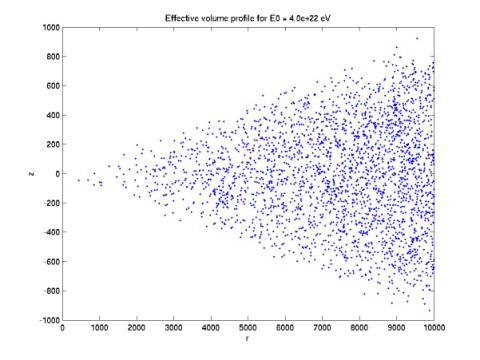
Figure 6
3/16/03
Effective
cone bounding curves
plotEffVol.m
We
see that for a given neutrino energy, the effective volume is bounded by a
cone. Figure 7 gives the curves bounding these cylinders for various energies.
The lowest curve terminates at a maximum radius less than the 10 km cut off.
Note that at ~10^22 eV the bounding cone stops growing with energy. We can
require that reconstructed events lie below these curves if they are neutrinos.
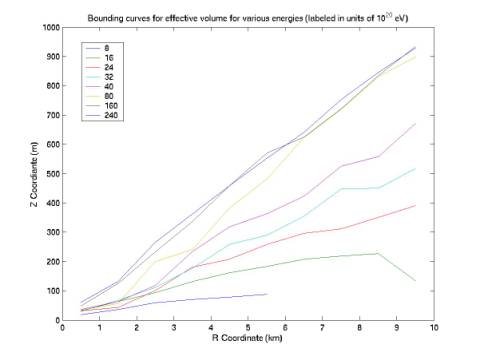
Figure 7