Log 26
Justin
Vandenbroucke
justinv@hep.stanford.edu
Stanford
University
This file contains log entries summarizing the results of various small subprojects of SAUND. Each entry begins with a date, a title, and the names of any relevant programs (Labview .vi files or Matlab .m files – if an extension is not given, they are assumed to be .m files).
Note:
Higher-resolution versions of the figures are available. If a log has URL dirname/logLL.html,
Figure FF of the log should be at URL dirname/FF.jpg.
5/27/04
Trying
to get pretty, smooth log-log contours
logGridContours.m
calcFilterValuesRect.m
Figure
1 shows log-log contours (from lattice (rects) 129-134). Figure 2 shows an example of a pressure
pulse for one lattice point, and Figure 3 shows a close-up. I believe the roughness in the upper
quadrant of Figure 1 is due to the noise in Figures 2 and 3, which is likely due
to precision limitations in somewhere in the simulation.
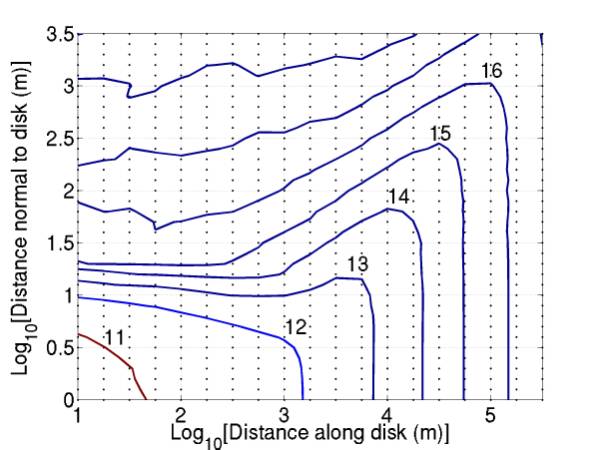
Figure 1
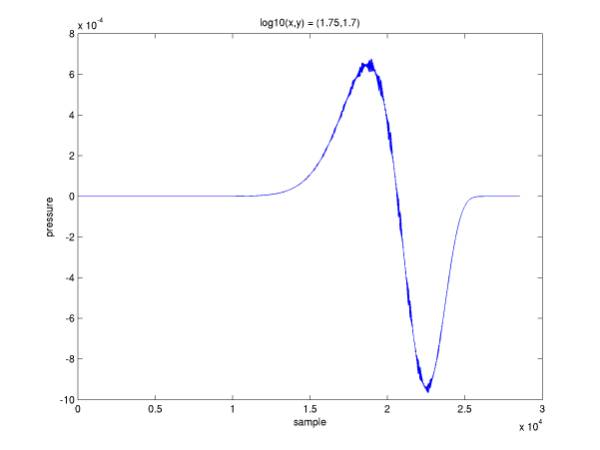
Figure 2
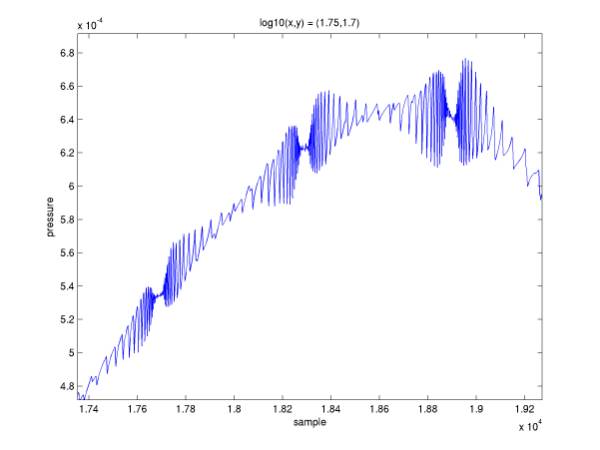
Figure 3
5/28/04
Log-log
contours, continued
logGridContours.m
calcFilterValuesRect.m
I
created a new lattice (rects 135-140, same coordinates as 129-134), with z discretization
of 0.5 m rather than 1 m.
This has had no
noticeable effect. Smoothing the
pressure pulse, however, does.
Figure 4 gives the contours from unsmoothed pressure pulses; Figure 5
gives the contours from pressure pulses smoothed by a running average over 10
samples. The location of the
contours is shifted slightly and smoothed (10^16 GeV, marked “16”,
is changed most).
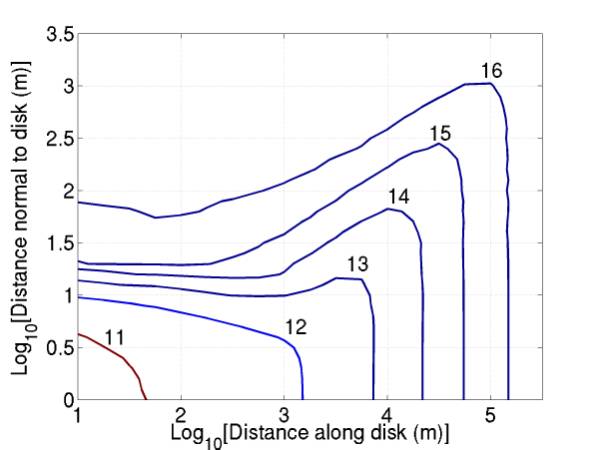
Figure 4
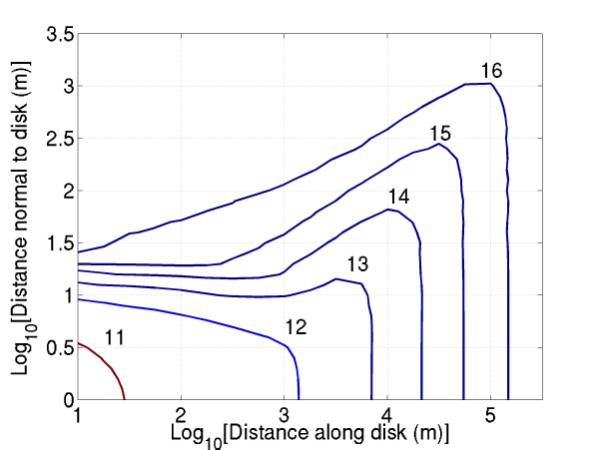
Figure 5