Special Geometry
We have seen that we distribution of delay time is different from what we would expect from a uniform sound source distribution. Part is due to the limit of our fit function that cannot pick up bottom reflections that is too close to the primary signal (which corresponds to 90 degree of reflection angle), part may be due to the possibility that the sound sources themselves are not uniformly distributed.
The distribution of delay time for events with different frequencies is as follows:
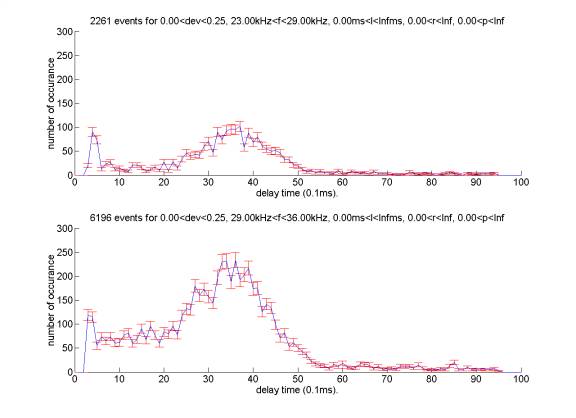
Note that distribution for 23kHz-29kHz category is almost symmetric with respect to the middle. However, there seem to be more events with delay time from 1ms to 2ms for 29kHz-36kHz category. We will show in another summary that the event in this region may have some interesting property.
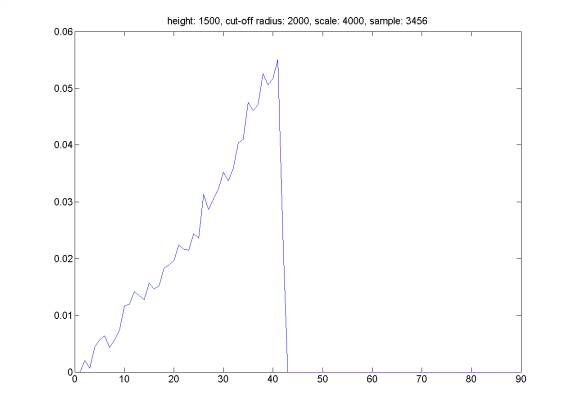
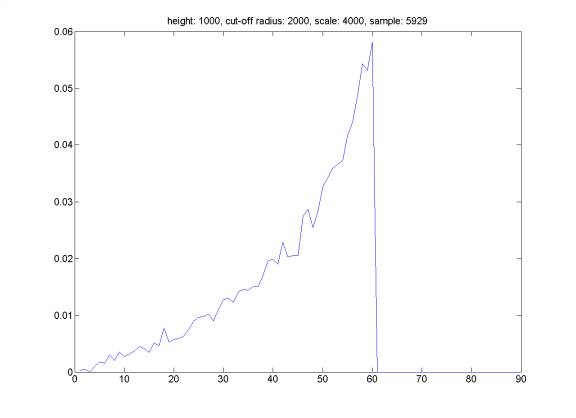
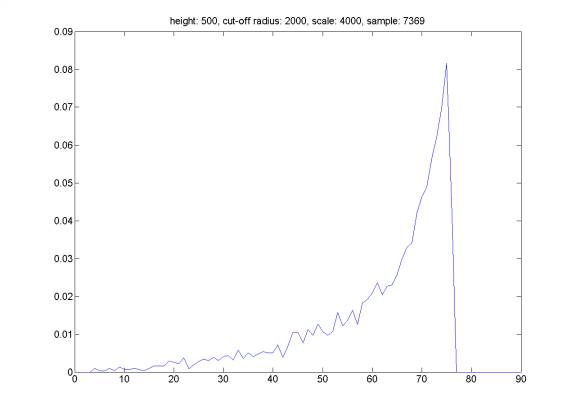
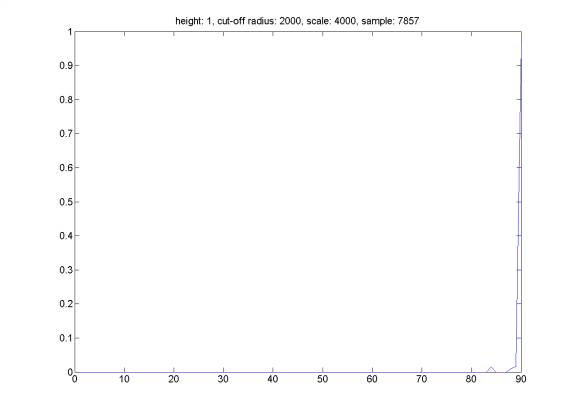
Here is the distribution of reflection angle for randomly generated events satisfying the following property: we assume that all events happening at a distance HEIGHT above the see-floor. The hydrophone does not trigger an event farther than distance CUT-OFF RADIUS. We select events from a plane square of SCALE*SCALE meters with hydrophone at the center of the square. We can see that the distribution of reflection angle is related to the distribution of the sound sources. However, it is very difficult to reconstruct event distribution based on reflection angle distribution (the opposite direction is straightforward).
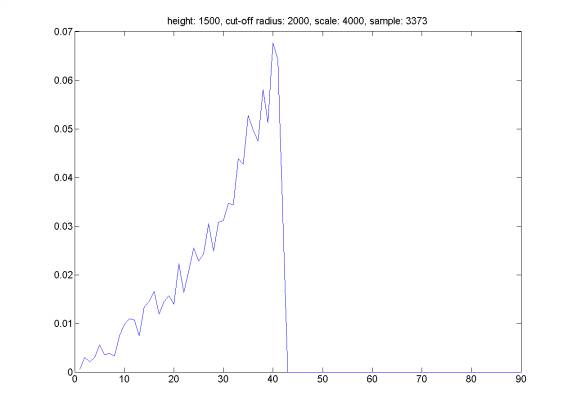
Same plot, but assume that the probability of triggering is proportional to the inverse of the distance from hydrophone.
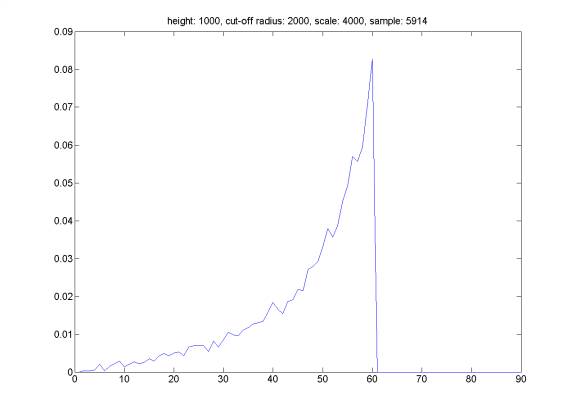
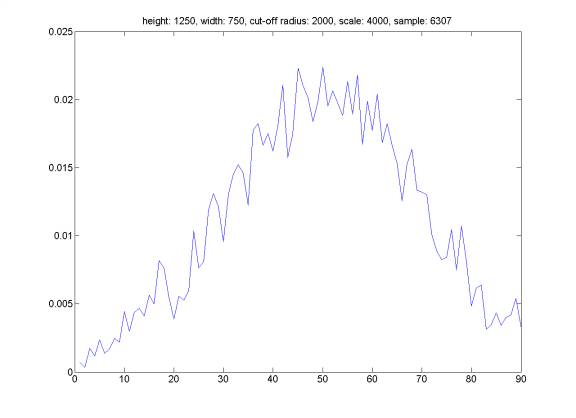
Here is the distribution of reflection angle for randomly generated events satisfying the following property: we assume that the probability of event happening is a Gaussian distribution around distance HEIGHT above the see-floor with a width equal to WIDTH. The hydrophone does not trigger an event farther than distance CUT-OFF RADIUS, and we select events satisfying above criteria from a set of totally randomly distributed events in a cube box of SCALE*SCALE*SCALE meters with hydrophone at the middle at the bottom face of the cube. We can see that the distribution of reflection angle is related to the distribution of the sound sources. However, it is very difficult to reconstruct event distribution based on reflection angle distribution (the opposite direction is straightforward).
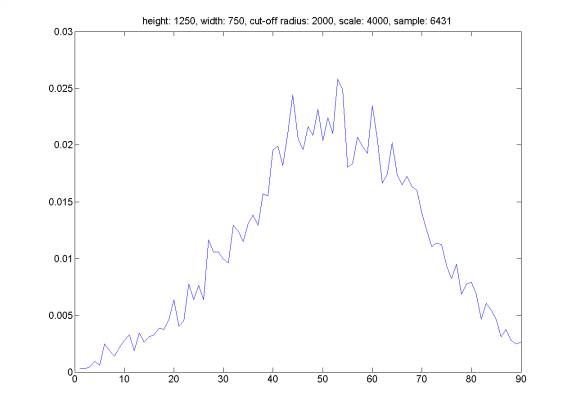
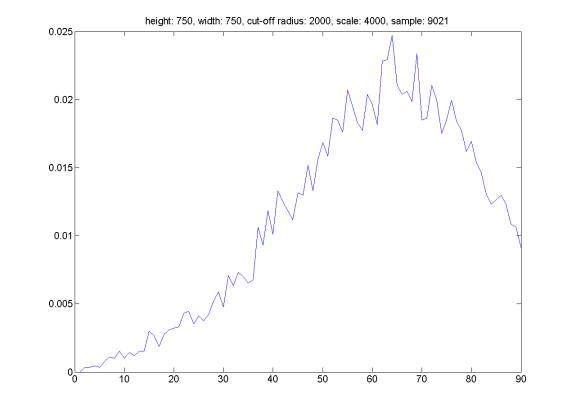
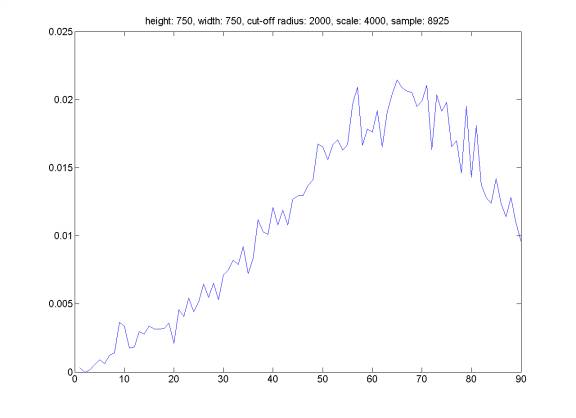
Same plot, but assume that the trigger probability is proportional to the inverse of the distance from hydrophone.
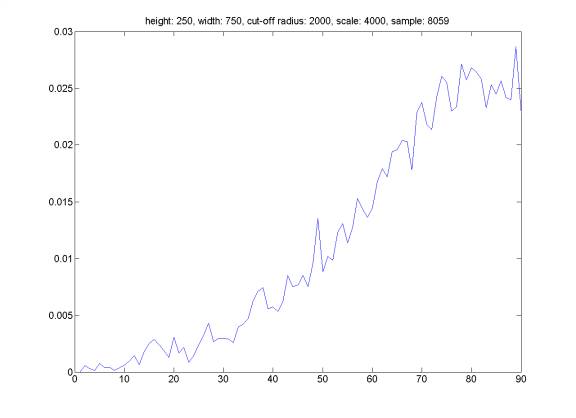
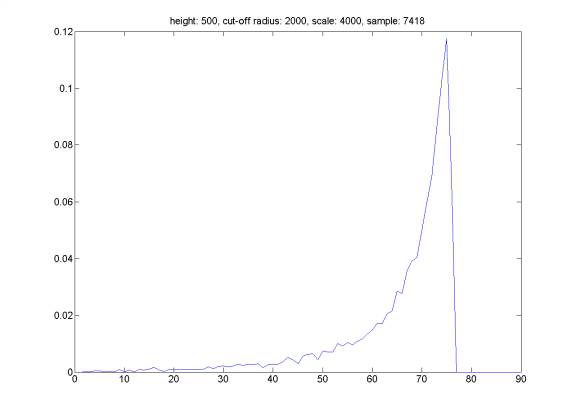
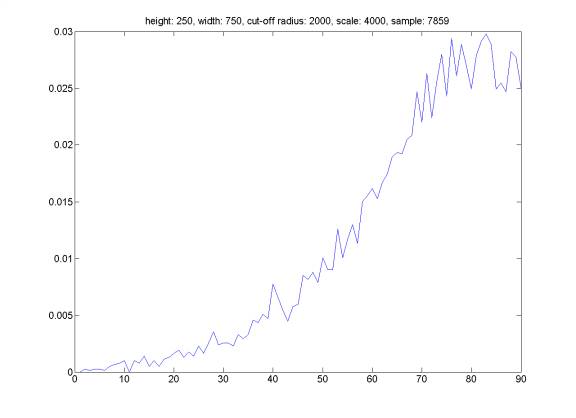
Here is the distribution of reflection angle for randomly generated events satisfying the following property: the hydrophone does not trigger an event farther than distance CUT-OFF RADIUS, and we select events from a set of totally randomly distributed events in a cube box of SCALE*SCALE*SCALE meters with hydrophone at the middle at the bottom face of the cube.